

FigCanvas ranks first for its focused research workflow and clearly documented publication exports. SciDraw is the stronger choice for a broad tool catalog and multiple generation modes. FigureLabs offers promising scientific-visualization paths, but missing price information and slow mobile interaction make it the least certain purchase.
FigCanvas offers the clearest publication workflow
FigCanvas ranks first. Our review found unusually complete answers to researchers’ practical questions, including figure types, editing, publication rights, export formats, coding requirements, and free-tier limits. Its confirmed tools cover scientific illustrations, graphical abstracts, PRISMA diagrams, forest plots, volcano plots, flowcharts, and color palettes. Pro also lists editable SVG and 300 DPI PDF exports. That combination reduces uncertainty for researchers preparing manuscripts, posters, and grant materials.
The tradeoff is mobile execution. Our lab results measured homepage LCP at 3.3 seconds and time to interactive at 10.7 seconds. The homepage also transferred at least 3.7 MiB, while the mobile layout contained 29 undersized interaction targets. Researchers working mainly on desktop may accept those constraints; frequent phone and tablet users have stronger reasons to hesitate. The site’s claim of more than 20,000 researchers was not accompanied by an attributable customer outcome in our review.
SciDraw has more modes and more choice to navigate
SciDraw ranks second. It confirms multiple AI generation modes, sketch-to-illustration refinement, data visualization, graphical abstracts, editable illustration exports, and chart export. Its pricing page also presents an education-discount route and clearly distinguishes credit allowances across its paid plans. This makes it the better match for educators or research teams that value a large catalog and several usage levels.
Breadth creates its main usability cost. Our review found more than 140 tools, with category counts reaching 186 items, so selecting the right starting point requires scanning and filtering. Mobile performance is also the weakest of the three on the available loading measurements: real-user p75 LCP was 5.086 seconds, while the lab result reached 6.3 seconds with 13.1 seconds to interaction. The homepage carried 6.5 MB across 177 requests. Choose SciDraw for breadth, not for the fastest mobile start.
FigureLabs loads its main content sooner but becomes interactive slowly
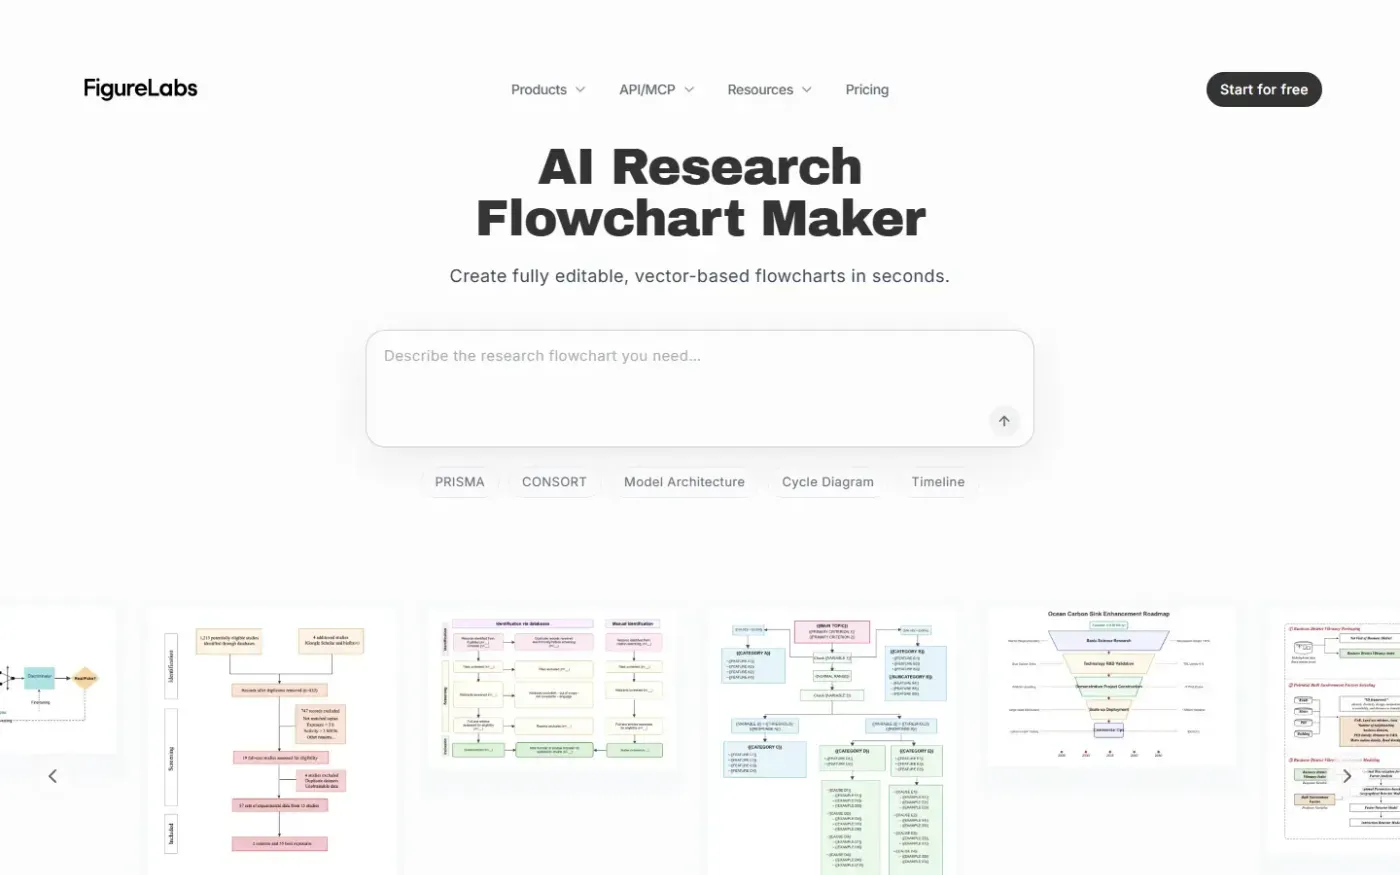
FigureLabs ranks third, although it has genuine strengths. Its scientific-visualization paths include illustrations, flowcharts, plots, and an API described as accepting text, sketches, or reference images. Field LCP was 1.93 seconds and layout shift was low at 0.03, both stronger results than its mobile lab experience suggests. The sampled pages were server-rendered and passed the basic mobile overflow checks.
The important constraint is uncertainty at the buying stage. The provided pricing URL returned a 404 page, so current plan amounts cannot be confirmed. Mobile lab testing measured 1,334 ms of blocking time and 14.5 seconds to interactive, and the interface included 24 undersized tap targets. FigureLabs is most defensible for buyers who value its API and sketch-based paths and are willing to verify pricing and signup details directly.