SiteList review score
Clear scientific-visualization offer with useful audience and pricing detail. Mobile performance is the clearest fix, with field p75 LCP at 5.086 seconds.
Reviewed on Oct 9, 2026
sci-draw.com
Unclaimed listingWhat it does
SciDraw AI is a web-based platform for generating scientific illustrations, diagrams, graphical abstracts, and data visualizations from text, sketches, reference images, or data, with refinement and export options for papers, presentations, and teaching.
SiteList review score
Clear scientific-visualization offer with useful audience and pricing detail. Mobile performance is the clearest fix, with field p75 LCP at 5.086 seconds.
Reviewed on Oct 9, 2026
Verified user rating
—
No verified reviews yet — the evidence locker is empty.
Captured during our latest review on Oct 9, 2026
Free plan includes 10 credits on registration and 5 free credits daily. Paid plans are billed monthly or annually; annual prices shown are $120, $240, and $480 for Standard, Premium, and Enterprise respectively. Billed monthly. free plan · Free plan with 10 registration credits and 5 free credits daily.
| Plan | Price | Details |
|---|---|---|
| Free | $0 monthly per credits | Free plan with 10 registration credits and 5 free credits daily. 10 credits on registration · 5 free credits every day · 30-day history retention View source |
| Standard | $10 monthly per credits/month | 300 credits/month, approximately 60 images. 300 credits/month · Permanent history retention · 3x faster image generation View source |
| Premium | $20 monthly per credits/month | 800 credits/month, approximately 160 images. 800 credits/month · Permanent history retention · 3x faster image generation View source |
| Enterprise | $40 monthly per credits/month | 2,000 credits/month, approximately 400 images. 2,000 credits/month · Permanent history retention · 5x faster image generation View source |
AI scientific figure generation
generation
Generates scientific illustrations and figures from text prompts.
Graphical abstract creation
generation
Creates graphical abstracts.
Sketch-to-illustration refinement
generation
Refines uploaded sketches into illustrations.
Data visualization
visualization
Creates scientific charts from CSV or Excel data.
Editable illustration exports
export
Exports editable SVG and PPTX files.
Chart file export
export
Exports chart files and supports SVG, PNG, PDF, EPS, and TIFF formats.
Multiple AI generation modes
generation
Provides text-to-image, sketch refinement, and style replication modes.
Scientific publishing
Create figures and graphical abstracts for papers and journal publication.
Research presentations
Create scientific illustrations and data visualizations for presentations.
Teaching
Create diagrams and teaching illustrations.
Science communication
Create research graphics and educational diagrams for science communication.
You own the images you generate. Journal publication and commercial use require a paid plan; on the free plan, images are for personal and evaluation use.
One image consumes 5 credits, and each round of multi-round optimization also consumes 5 credits. New users get 10 credits on registration plus 5 free credits every day; gift credits are valid for one day.
A refund can be requested within 7 days of the first purchase if less than 10% of paid credits have been used. Approved refunds return to the original payment method minus a 10% processing fee, except for duplicate charges or billing errors.
An initial draft usually takes 3-10 seconds. Each multi-round optimization takes about 5-8 seconds, and the full process averages 3-5 minutes.
Text-to-image creates from text, sketch refinement transforms uploaded sketches, and style replication generates based on existing images.
Product FAQ information · View source
SciDraw scores 72/100, rounded from a persisted 72/100, for a clear scientific-visualization offer aimed at researchers, educators, students, journal editors, and science communicators. Its strongest foundations are audience clarity, pricing detail, and crawlability; its most material weakness is mobile performance, with field p75 LCP at 5.086 seconds.
72/100, rounded from 72/100: a credible platform with a clear offer and a meaningful performance gap
No reviews yet. The evidence locker is empty.
Reviews from verified users appear here once approved.
Reviews are from the SiteList community. Some reviewers received incentives — disclosed in the review, always. The verdict is never for sale.
Home
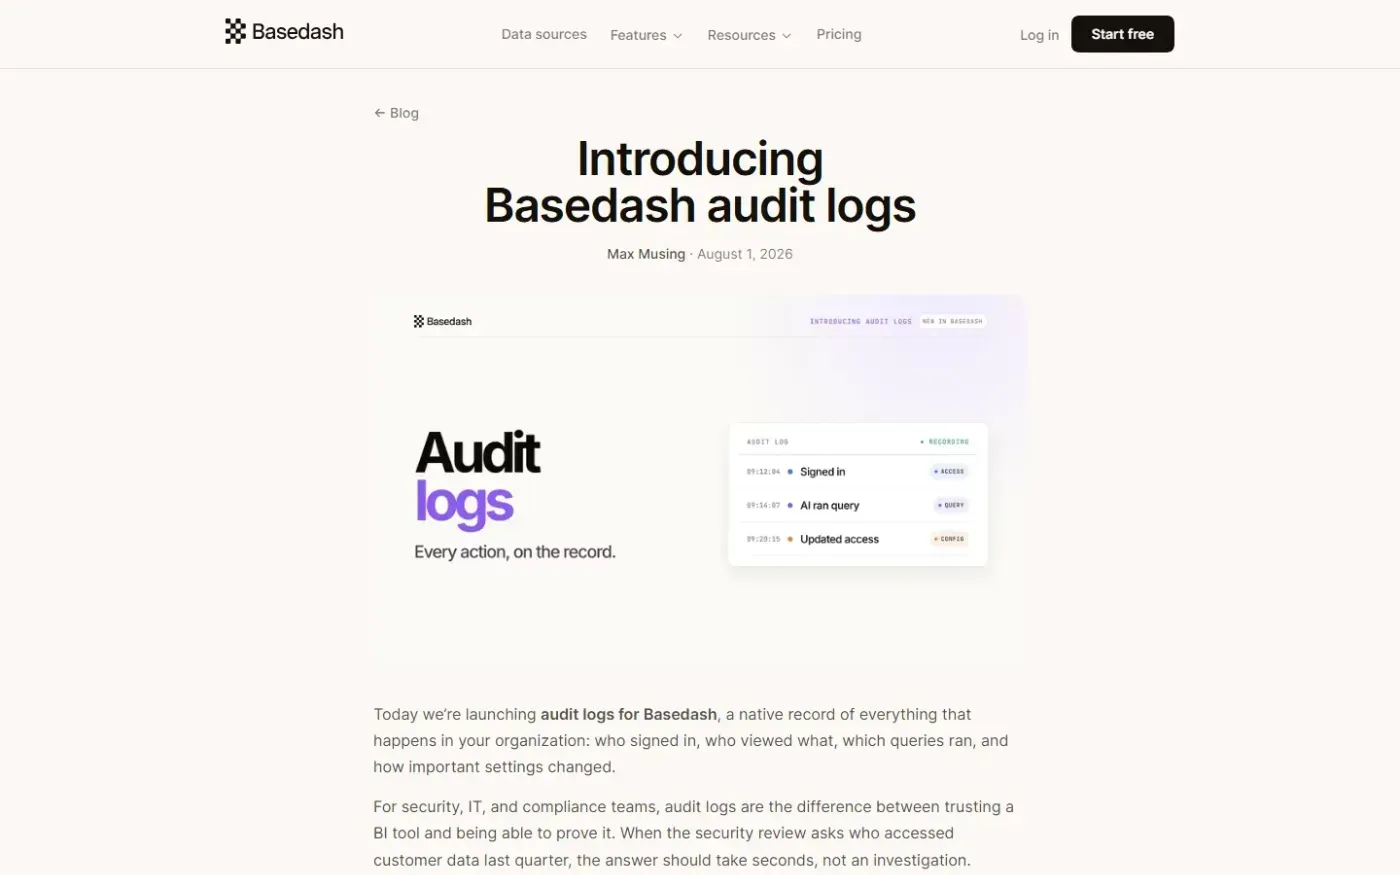
Basedash Audit Logs — Every action in your BI tool, on the record. screenshot 1 of 4: Home
basedash.com
Basedash is an AI-native business intelligence platform that provides natural language querying, dashboards, and reporting workflows without heavy BI setup.
Home
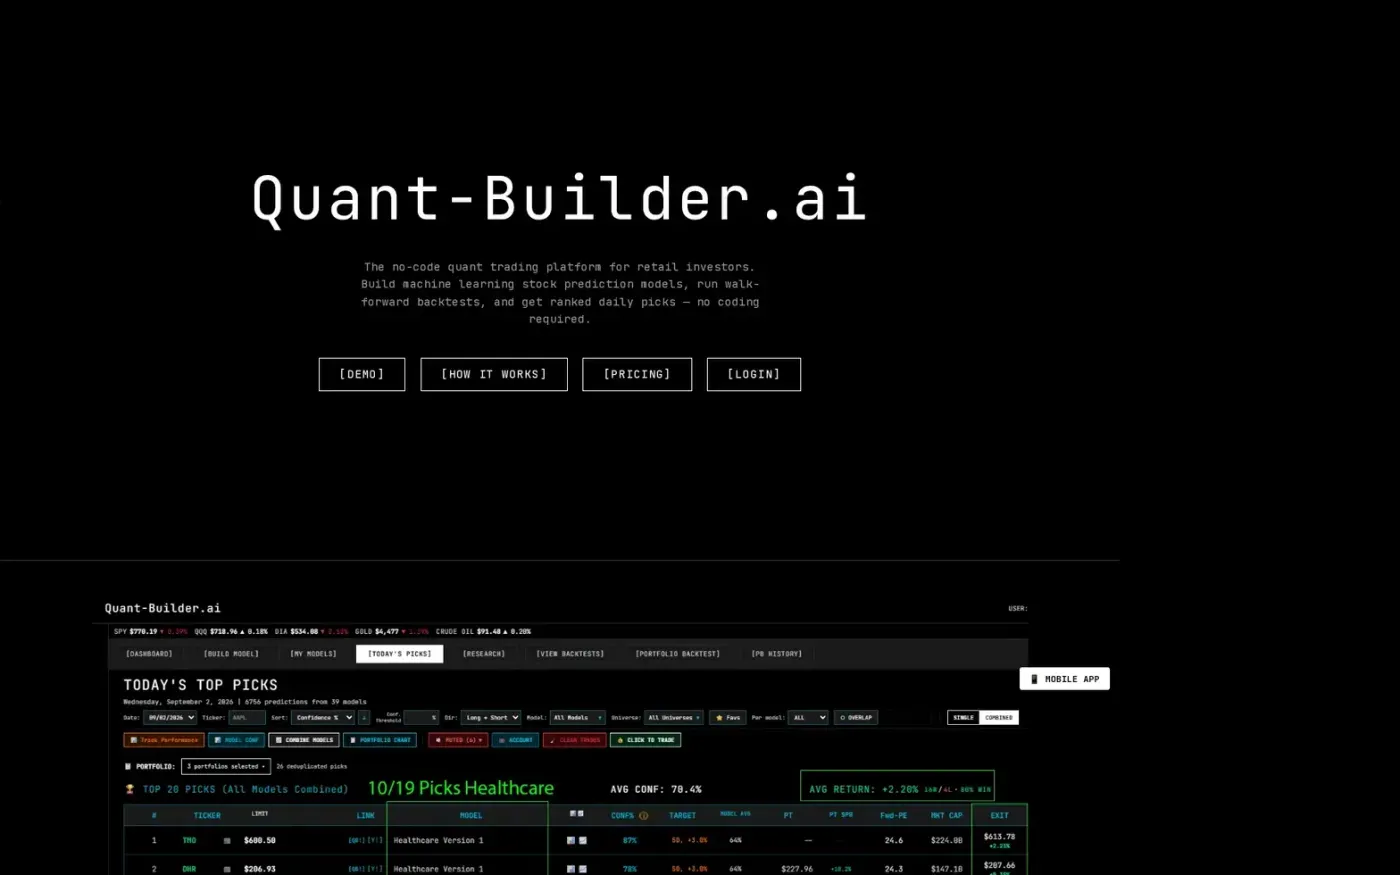
Quant-Builder.ai screenshot 1 of 4: Home
quant-builder.ai
Quant-Builder.ai is a no-code quant trading platform for retail investors to build, backtest, and automate machine learning stock prediction models. It offers 30 years of point-in-time data, 750+ features, and daily confidence-ranked stock picks without requiring coding knowledge.
Home
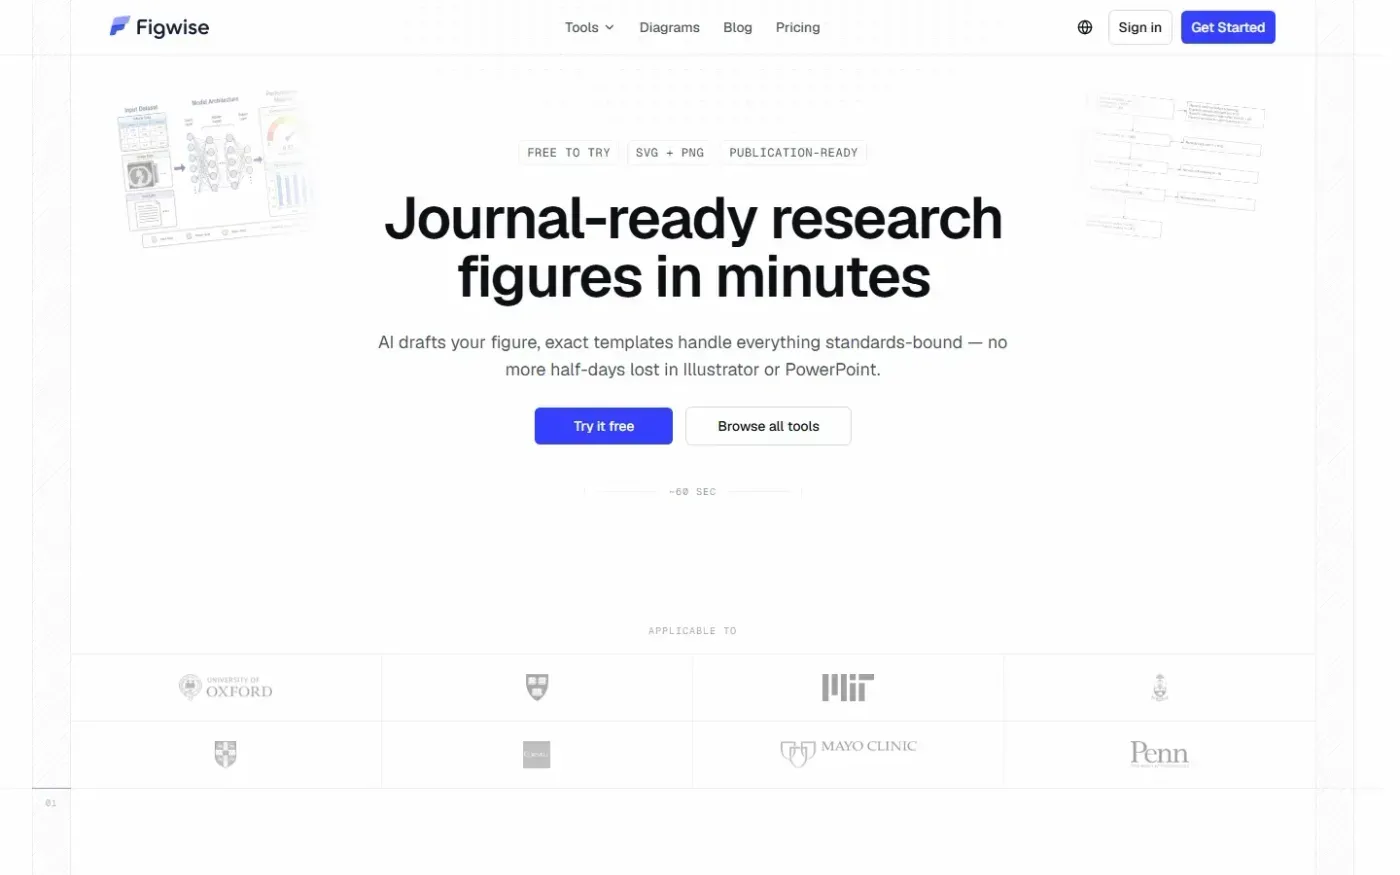
Figwise screenshot 1 of 4: Home
figwise.app
Figwise is an AI-powered scientific figure generator that creates publication-ready research figures, graphical abstracts, flow diagrams, and statistical charts with export support in SVG and PNG formats.
Home
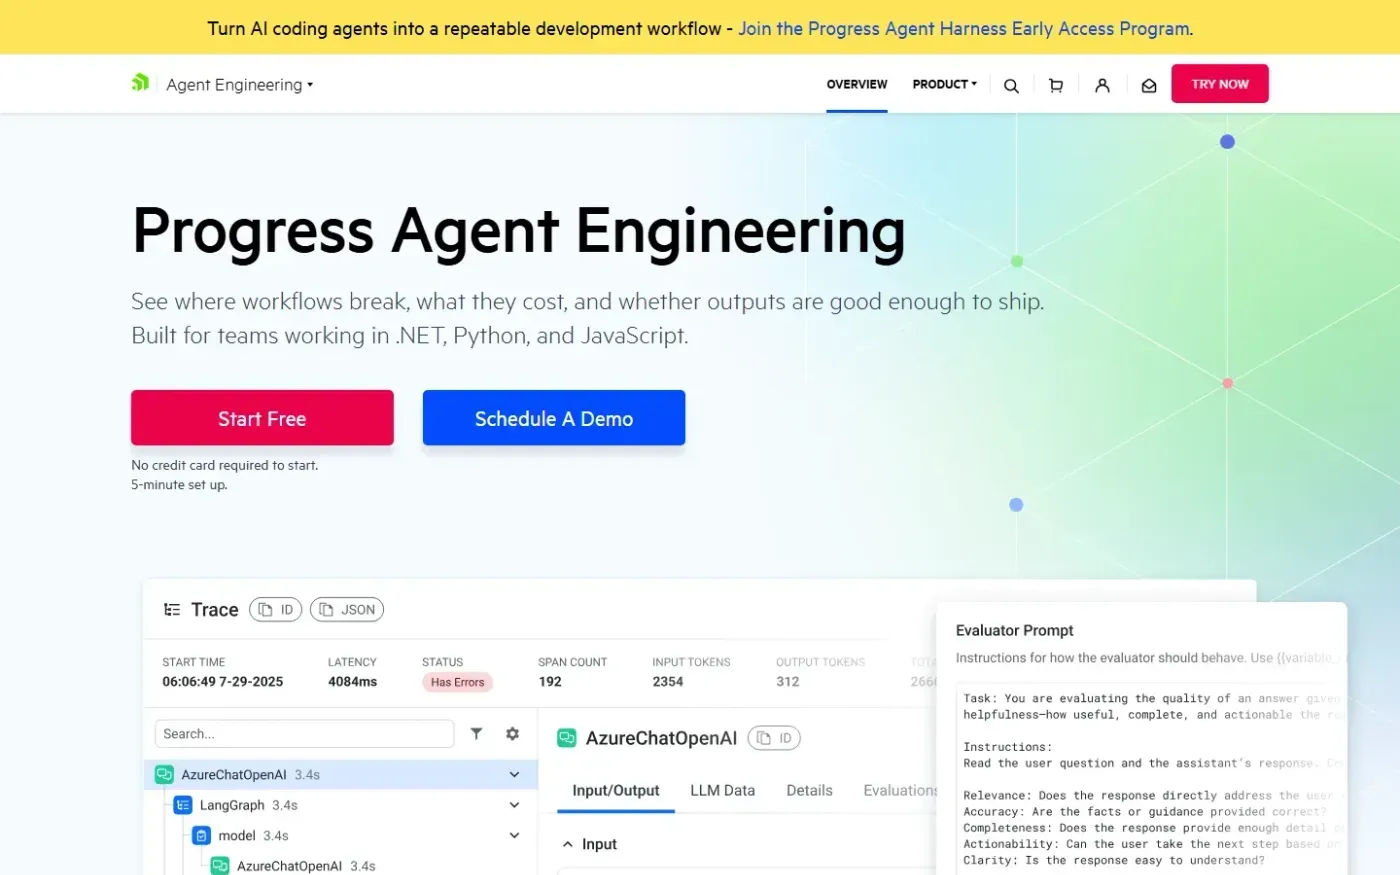
Progress AI Observability — Trace, evaluate, and improve AI agents in production screenshot 1 of 4: Home
telerik.com
The Progress Agent Engineering Platform captures trace-level data from AI agents and LLM applications, including prompts, responses, model calls, retrieval steps, tool use, latency, token usage, and cost signals. It enables teams to debug failures, monitor production costs, evaluate output quality, and optimize workflows across .NET, Python, and JavaScript.