SiteList review score
Clear AI figure workflows for researchers, with practical guidance and export detail. Mobile performance and presentation consistency need focused fixes.
Reviewed on Oct 9, 2026
figcanvas.com
Unclaimed listingWhat it does
FigCanvas is an AI-powered scientific figure tool for researchers that creates scientific illustrations, data visualizations, and flowcharts from text or uploaded data, with an online canvas for refinement and export.
SiteList review score
Clear AI figure workflows for researchers, with practical guidance and export detail. Mobile performance and presentation consistency need focused fixes.
Reviewed on Oct 9, 2026
Verified user rating
—
No verified reviews yet — the evidence locker is empty.
Captured during our latest review on Oct 9, 2026
Free tier; Pro Monthly is $19.90/month. Pro Yearly is $149.90 billed annually, equivalent to $12.50/month. Billed monthly. free plan · Free plan with daily credits; no credit card required.
| Plan | Price | Details |
|---|---|---|
| Free | $0 custom per daily credits | 10 daily credits after the welcome period; PNG export with watermark and full publication rights. 30 credits on the first day · 18 daily credits for the rest of the first 3 days · Up to 3 projects · Up to 8 AI cards per project View source |
| Pro Monthly | $19.9 monthly per per month | 1,000 monthly credits for regular research figure work. View source |
| Pro Yearly | $149.9 annual per per year | Same Pro features; billed annually and equivalent to $12.50/month. View source |
Scientific illustrations
Figures and illustrations
Generate illustrations for pathways, mechanisms, cell biology, and experiment overviews from text prompts.
Data visualizations
Plots and charts
Generate publication-ready scientific visualizations from uploaded datasets or structured values.
Scientific flowcharts
Diagrams and flowcharts
Create experimental workflow, study design, research process, and analysis pipeline diagrams from plain-language prompts.
Volcano plot generation
Plots and charts
Generate volcano plots from RNA-seq, proteomics, and GWAS data with custom thresholds, gene labels, and color schemes.
Forest plot generation
Plots and charts
Generate forest plots from effect sizes and confidence intervals, including pooled estimates and subgroups.
Graphical abstract generation
Figures and illustrations
Create journal-ready graphical abstracts from plain-language descriptions.
PRISMA flow diagram generation
Diagrams and flowcharts
Generate and edit PRISMA 2020 flow diagrams from screening counts before export.
Scientific color palette selection
Colors
Apply colorblind-safe and publication-style palettes to research figures.
Figure export
Export
Export figures in PNG, SVG, and PDF formats depending on plan.
Research publication figures
Create publication-ready scientific illustrations, data visualizations, and flowcharts.
Experimental workflows and study designs
Create diagrams for experimental workflows, study designs, research processes, and analysis pipelines.
RNA-seq, proteomics, and GWAS analysis
Generate volcano plots from differential-expression and related research data.
Meta-analysis
Generate forest plots for meta-analysis using effect sizes and confidence intervals.
Journal graphical abstracts
Create graphical abstracts for research papers and journal submissions.
FigCanvas is an AI-powered scientific figure tool for researchers, students, and academic teams. It creates scientific illustrations, data visualizations, and flowcharts without requiring design skills or coding knowledge.
Yes. The free tier provides 30 credits on the first day, 18 per day for the rest of the first 3 days as a welcome bonus, then 10 credits per day thereafter. No credit card is required.
It generates data plots such as bar charts, scatter plots, heatmaps, and volcano plots; scientific illustrations such as cell diagrams, pathway figures, and mechanism diagrams; and flowcharts.
Yes. Figures are royalty-free and can be published in academic publications without additional licensing.
Free users can export PNG. Pro users can export high-resolution PNG, editable SVG, and PDF.
No. Users describe what they want in plain language and the AI handles the rest.
Yes. Data visualizations and flowcharts are directly editable on the canvas, and scientific illustrations can be converted into editable vectors.
Product FAQ information · View source
FigCanvas scores 74/100 for researchers who need AI-assisted scientific figures, with clear prompt-to-draft positioning and practical workflow content. Its most material weaknesses are mobile performance and presentation consistency, including a 3.3-second homepage LCP and 10.7-second time to interactive in the supplied lab runs.
74/100: capable research figure tool, mobile performance constraint
No reviews yet. The evidence locker is empty.
Reviews from verified users appear here once approved.
Reviews are from the SiteList community. Some reviewers received incentives — disclosed in the review, always. The verdict is never for sale.
Home
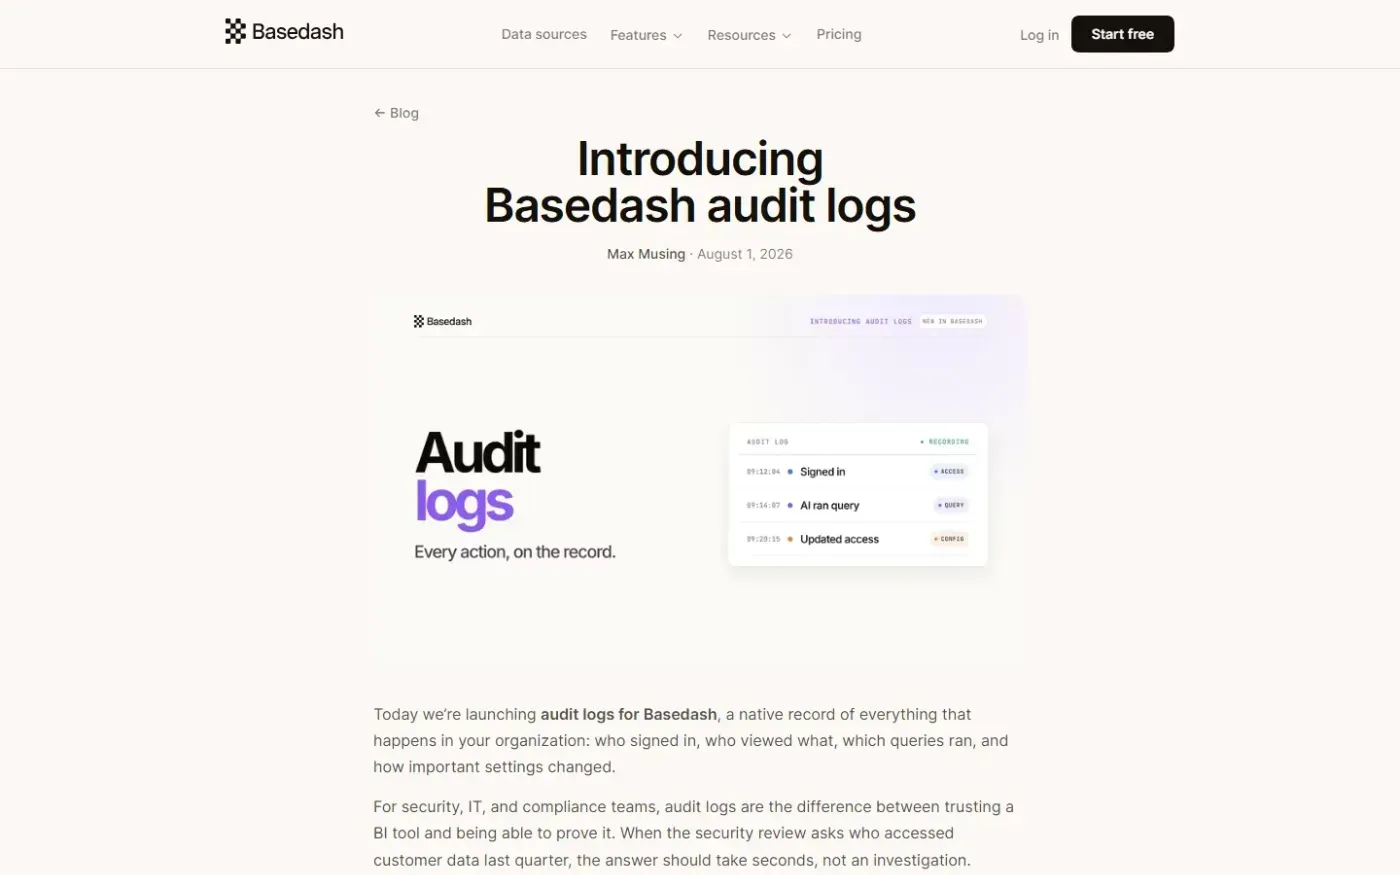
Basedash Audit Logs — Every action in your BI tool, on the record. screenshot 1 of 4: Home
basedash.com
Basedash is an AI-native business intelligence platform that provides natural language querying, dashboards, and reporting workflows without heavy BI setup.
Home
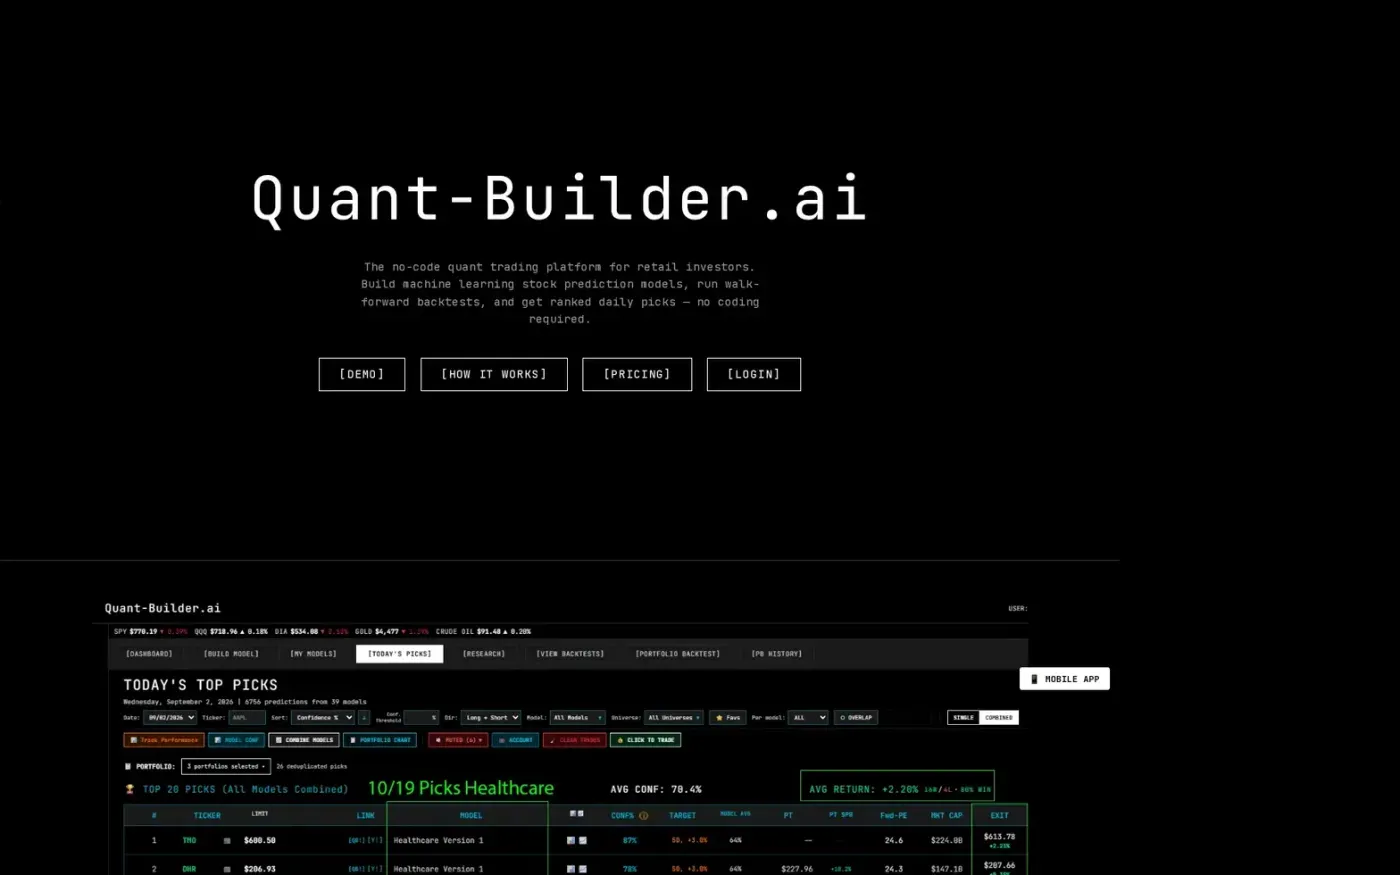
Quant-Builder.ai screenshot 1 of 4: Home
quant-builder.ai
Quant-Builder.ai is a no-code quant trading platform for retail investors to build, backtest, and automate machine learning stock prediction models. It offers 30 years of point-in-time data, 750+ features, and daily confidence-ranked stock picks without requiring coding knowledge.
Home
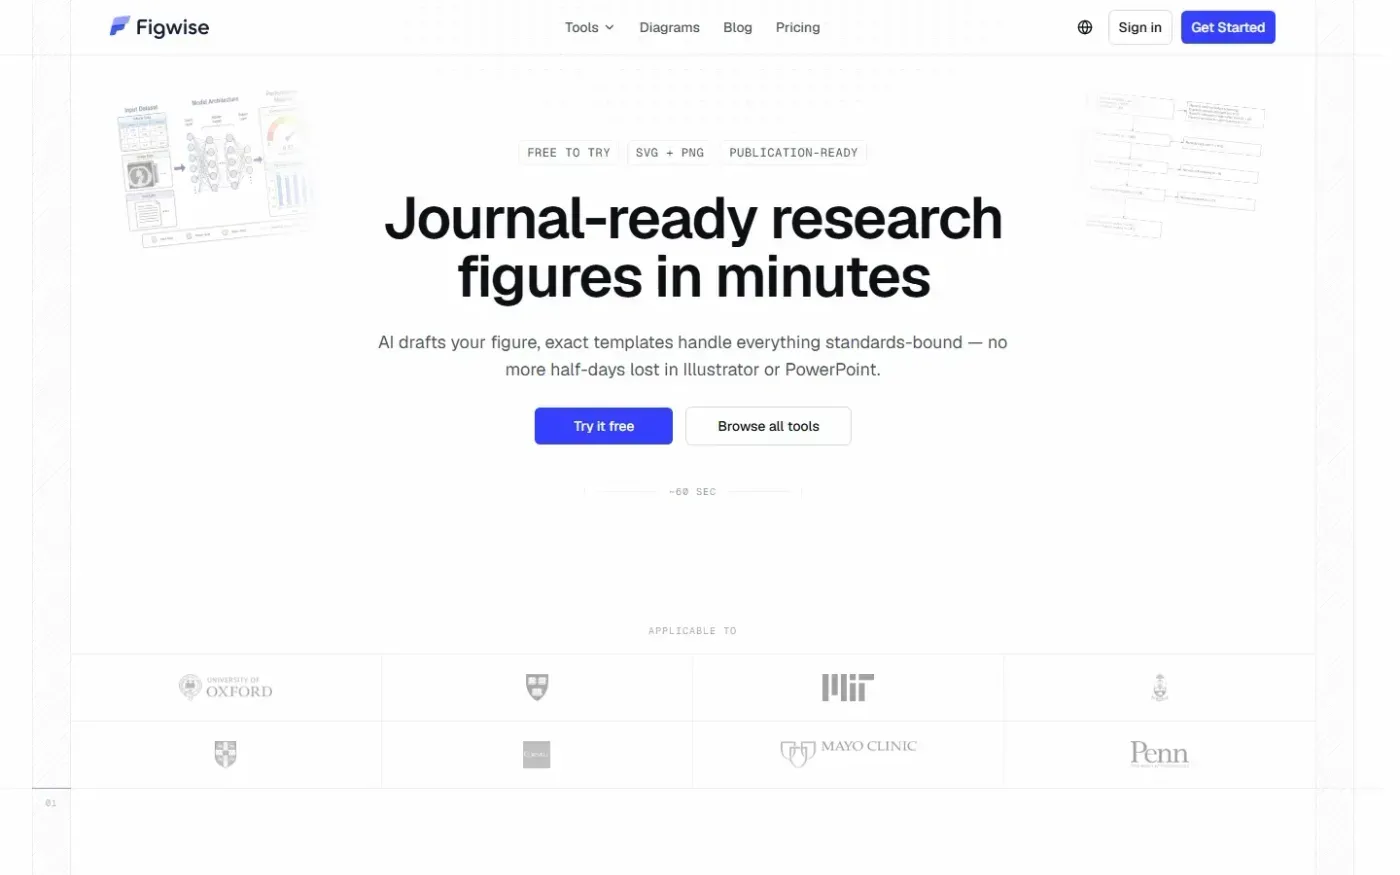
Figwise screenshot 1 of 4: Home
figwise.app
Figwise is an AI-powered scientific figure generator that creates publication-ready research figures, graphical abstracts, flow diagrams, and statistical charts with export support in SVG and PNG formats.
Home
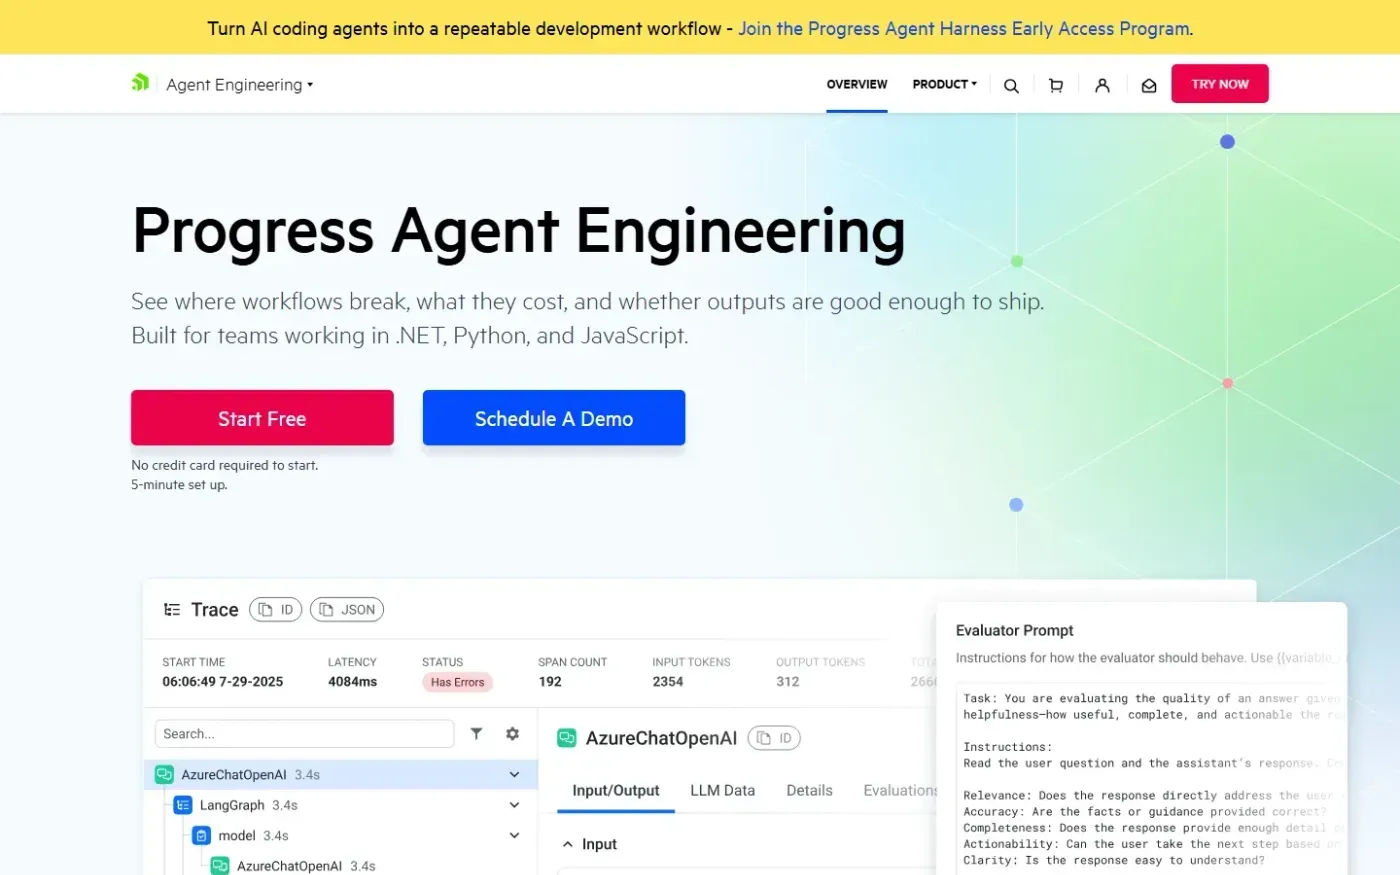
Progress AI Observability — Trace, evaluate, and improve AI agents in production screenshot 1 of 4: Home
telerik.com
The Progress Agent Engineering Platform captures trace-level data from AI agents and LLM applications, including prompts, responses, model calls, retrieval steps, tool use, latency, token usage, and cost signals. It enables teams to debug failures, monitor production costs, evaluate output quality, and optimize workflows across .NET, Python, and JavaScript.