SiteList review score
Clear charting workflows and a healthy crawl foundation. Mobile delivery is too slow, with /ai reaching main content at 18.8 s.
Reviewed on Oct 8, 2026
graphy.app
Unclaimed listingWhat it does
Graphy is an AI graph maker that turns data into shareable, customizable charts and presents data for storytelling.
SiteList review score
Clear charting workflows and a healthy crawl foundation. Mobile delivery is too slow, with /ai reaching main content at 18.8 s.
Reviewed on Oct 8, 2026
Verified user rating
—
No verified reviews yet — the evidence locker is empty.
Captured during our latest review on Oct 8, 2026
Free use is available for sharing interactive charts; paid upgrade removes the Graphy watermark and provides unlimited charts and AI use. free plan · The pricing page states that Graphy can be used for free.
View sourceAI graph generation
Chart creation
Generates charts with AI assistance.
Config-first chart API
Developer tools
Defines charts with a typed configuration object.
Built-in end-user editor
Editing
Allows end users to edit charts in place.
Fine-grained chart overrides
Customization
Provides overrides for axes, colors, and labels.
Pie and donut charts
Chart types
Supports config-driven pie and donut charts with built-in labels and percentages.
Bar chart variants
Chart types
Supports grouped, stacked, and 100% stacked bar charts, with sorting and built-in totals.
Data storytelling
Presents and communicates data through graphs.
React chart development
Provides chart components for React applications.
Recharts and Chart.js are low-level primitives where you own every visual decision. Graphy is a chart API with polished defaults, a built-in editor mode, and fine-grained overrides, producing production-quality output from a single typed config.
Yes. Graphy is a standard React component graphing library.
New chart types ship regularly, and feature requests can be opened on GitHub since much of the roadmap is community-driven. Components are also composable with standard SVG or Canvas elements for custom needs.
Yes. Setting mode="editor" on the Graph component unlocks an in-place editing UI where users can update titles, add annotations, and make modifications directly, with an onChange handler to persist changes.
Graphy is a private npm package distributed via a licensed API, with access managed through an npm auth token tied to the account, and plans discussed directly with the team.
Product FAQ information · View source
Graphy scores 66/100 as a clear charting and data-visualization product for internal reporting teams and developers. Its strongest foundations are positioning and technical SEO, while mobile performance is the most material weakness, with /ai reaching main content at 18.8 s.
66/100: capable charting product, serious performance drag
No reviews yet. The evidence locker is empty.
Reviews from verified users appear here once approved.
Reviews are from the SiteList community. Some reviewers received incentives — disclosed in the review, always. The verdict is never for sale.
Home
Aidiagramagent screenshot 1 of 4: Home
aidiagramagent.com
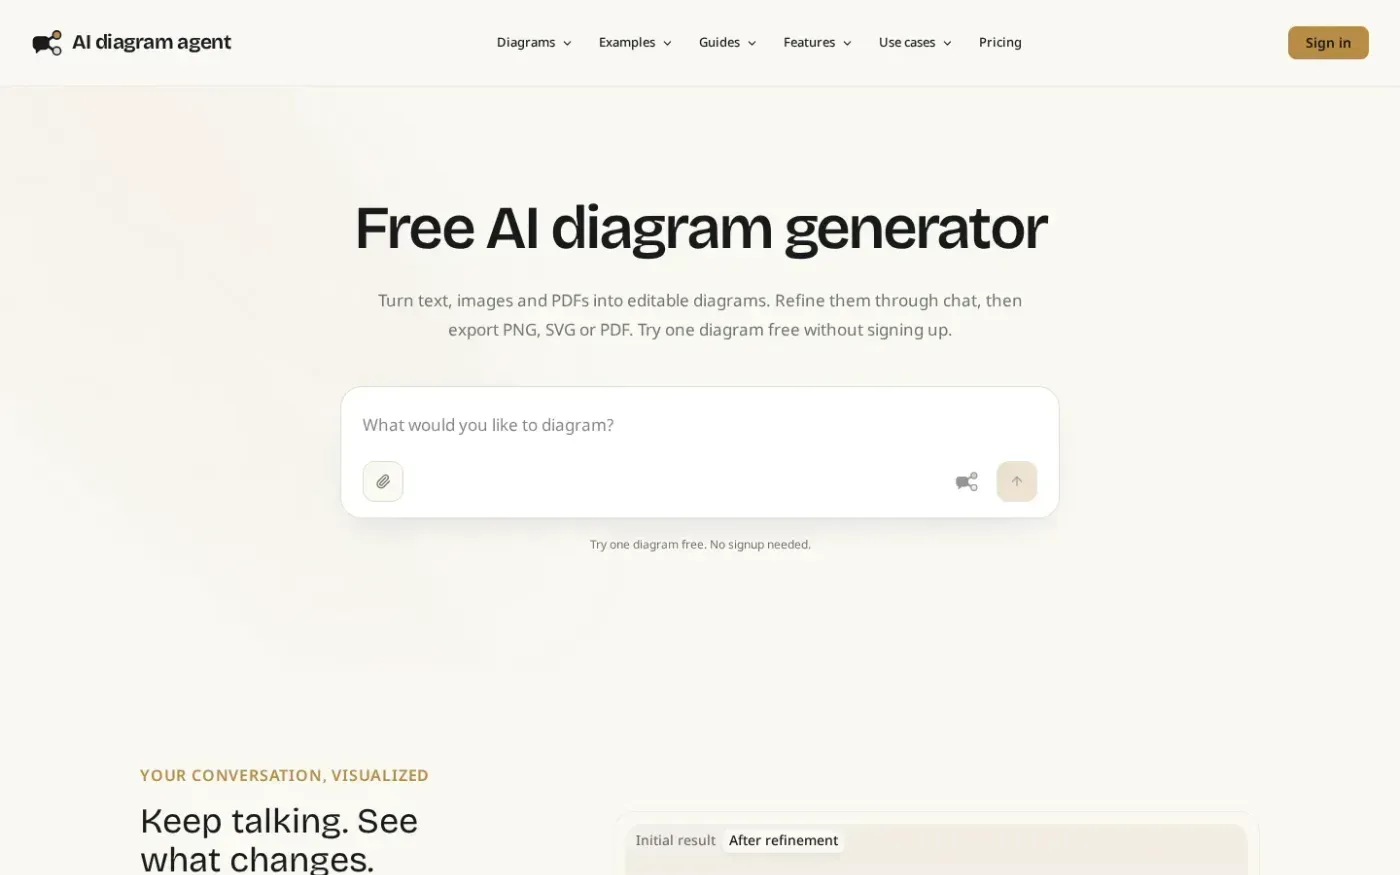
AI diagram agent turns text, images and PDFs into editable diagrams that users can refine through conversation, save as versions, export, and share.
Home
Basedash Audit Logs — Every action in your BI tool, on the record. screenshot 1 of 4: Home
basedash.com
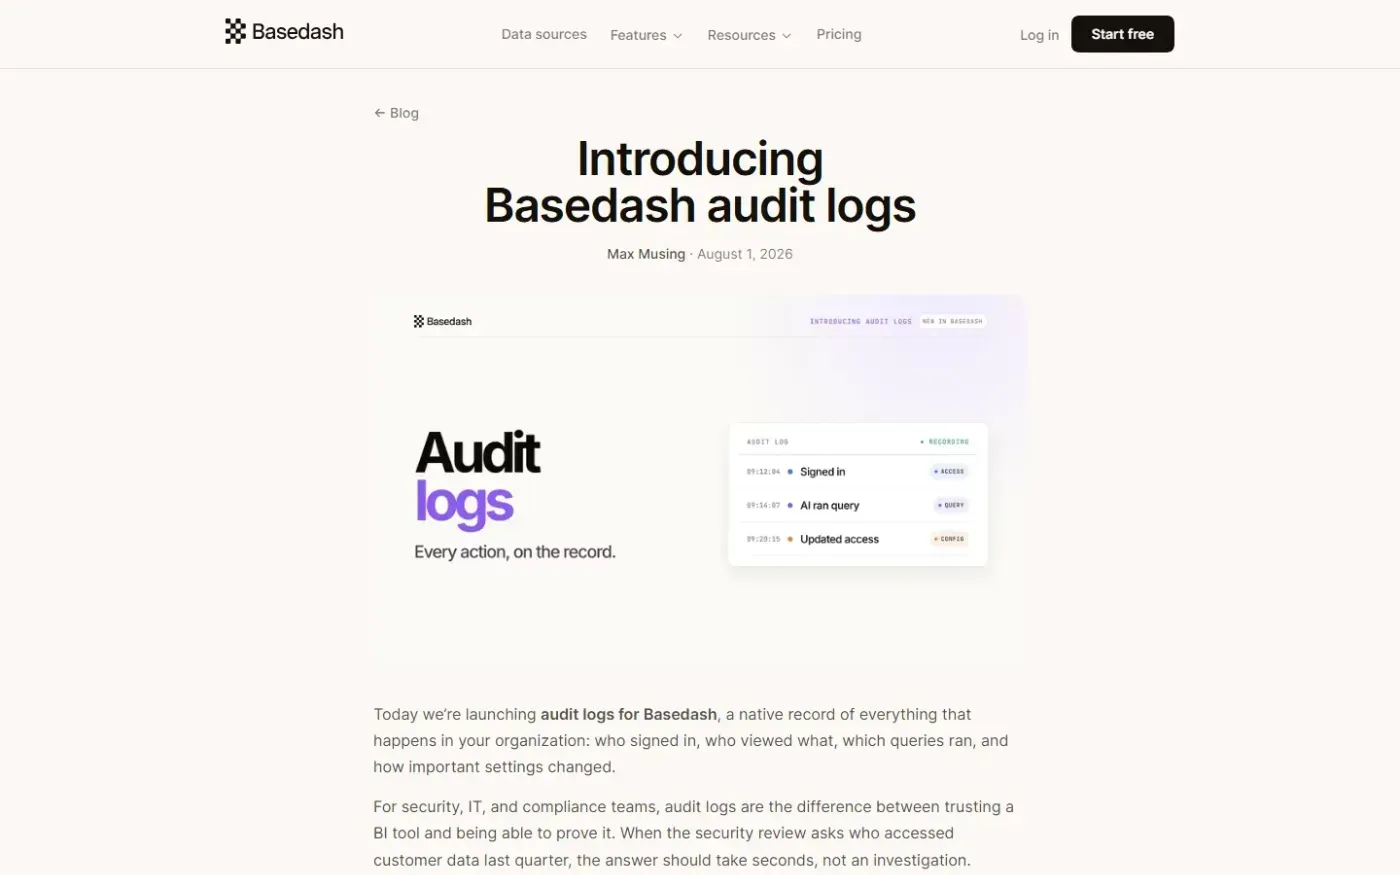
Basedash is an AI-native business intelligence platform that provides natural language querying, dashboards, and reporting workflows without heavy BI setup.
Home
Quant-Builder.ai screenshot 1 of 4: Home
quant-builder.ai
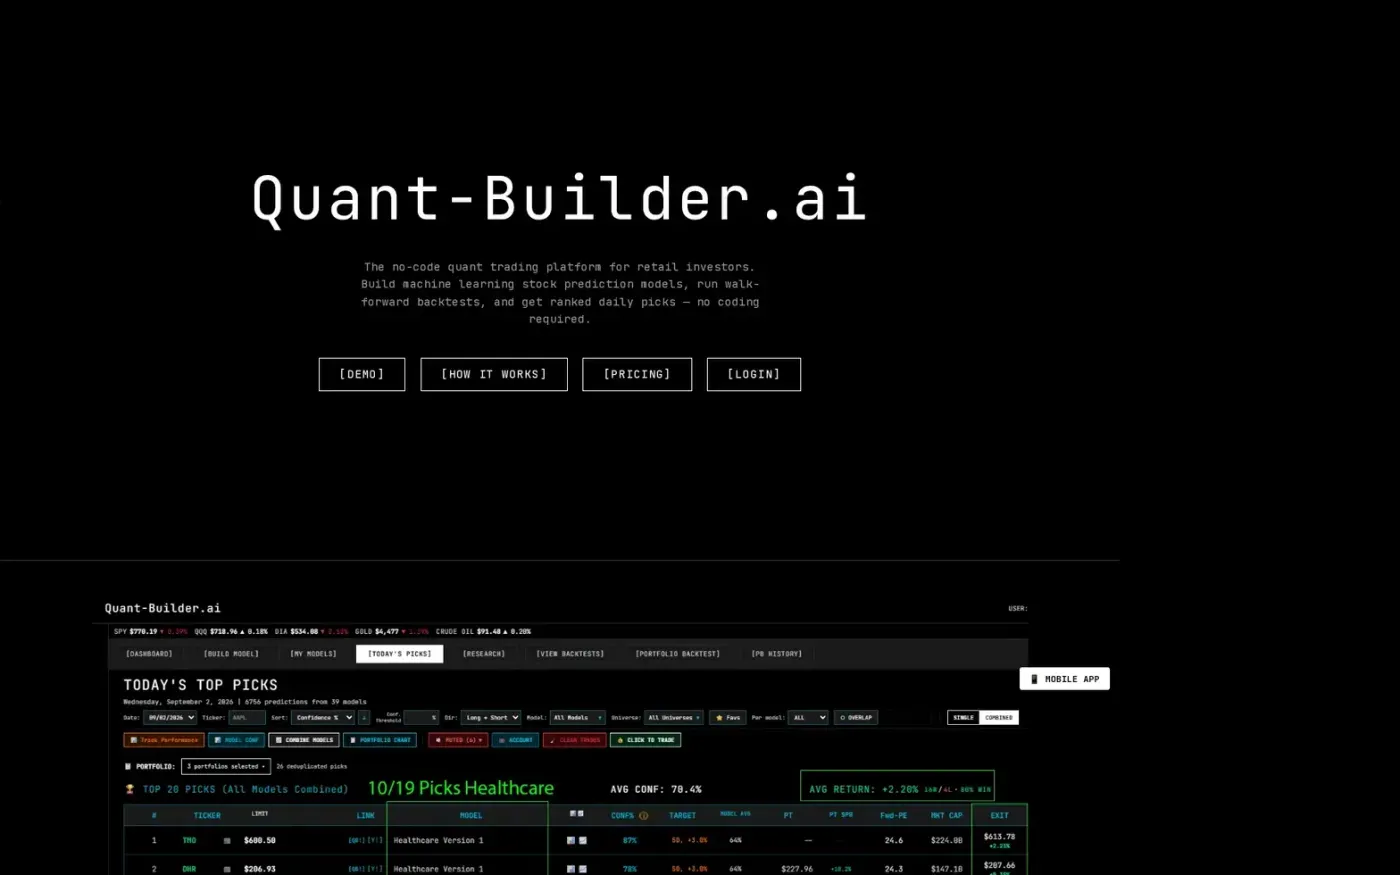
Quant-Builder.ai is a no-code quant trading platform for retail investors to build, backtest, and automate machine learning stock prediction models. It offers 30 years of point-in-time data, 750+ features, and daily confidence-ranked stock picks without requiring coding knowledge.
Home
Figwise screenshot 1 of 4: Home
figwise.app
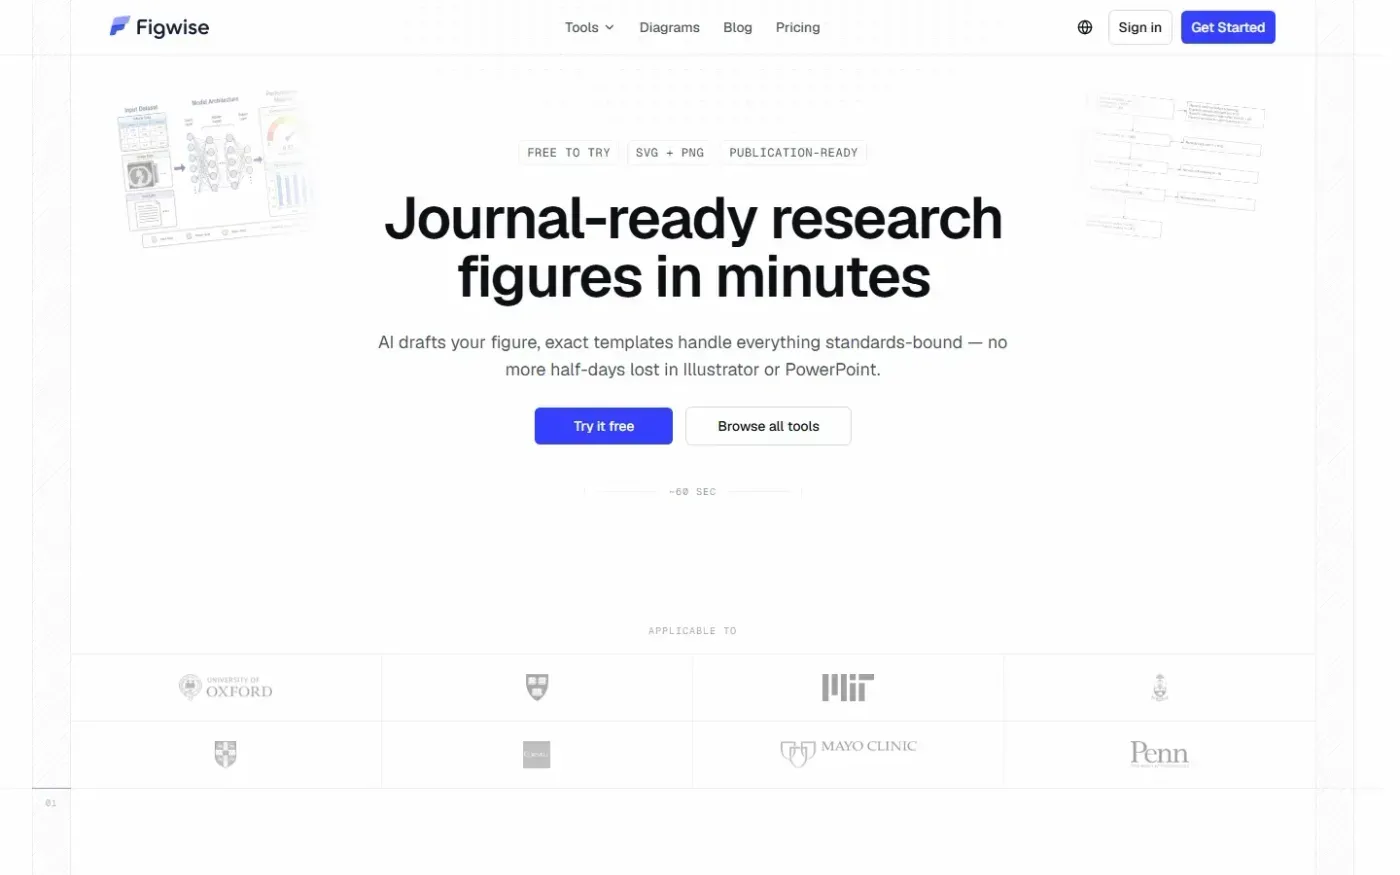
Figwise is an AI-powered scientific figure generator that creates publication-ready research figures, graphical abstracts, flow diagrams, and statistical charts with export support in SVG and PNG formats.